# [Data]
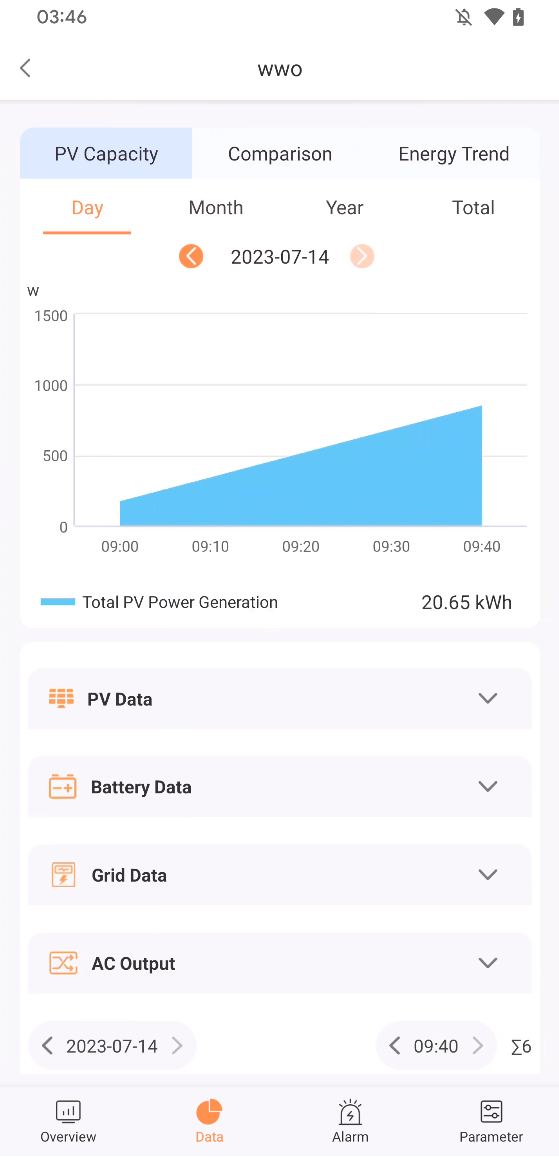
[PV Capacity Chart]
Display statistics and trend charts of PV for the day, month, year, and total dimensions.
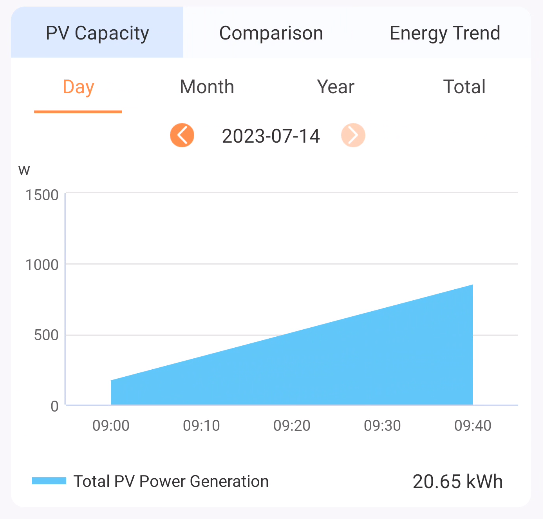
Click to toggle the total of the month and month.

Click to select a date.
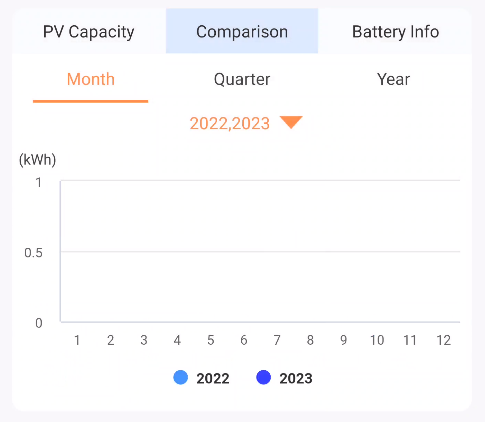
[Energy Comparison Chart]
Click on the year of the Chinese rose to switch the comparative data of different dimensions, you can click on the year to select the year that needs to be compared.
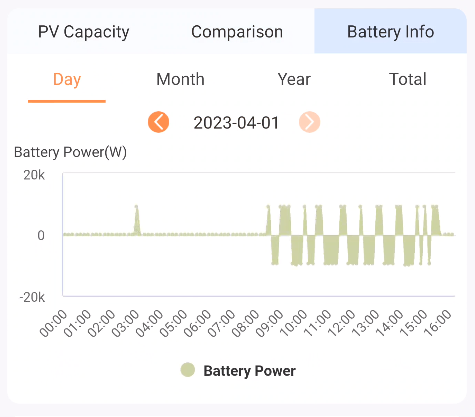
[Battery Infographic]
You can click on the total day and month total toggles the statistics of different dimensions, and you can click the date to switch different dates.
Real time data
View detailed data and display Device status according to time nodes.
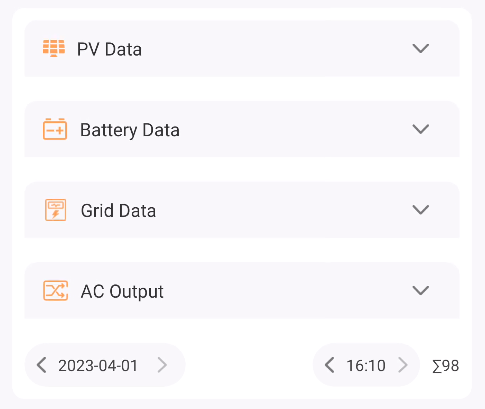
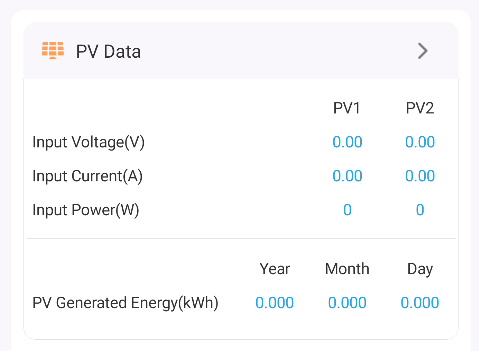
[Photovoltaic Data]
Voltage, current, power, etc.
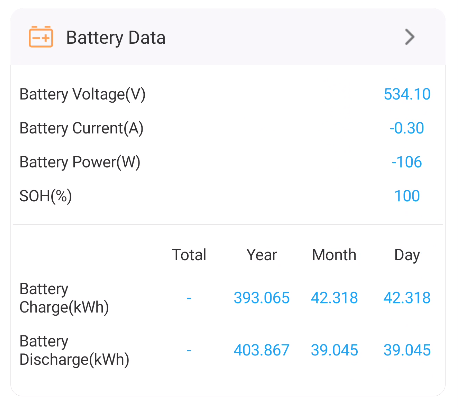
[Battery Data]
Battery power, current voltage, percentage capacity.
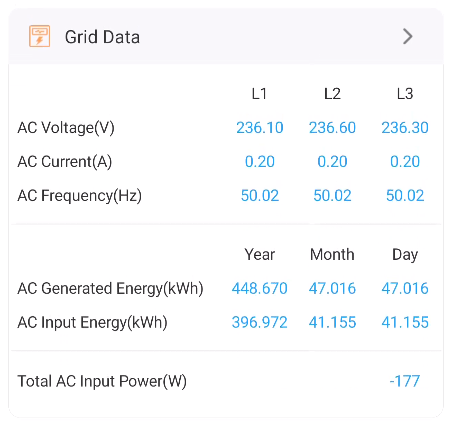
[Grid Data]
Voltage, current, power consumption, feed.
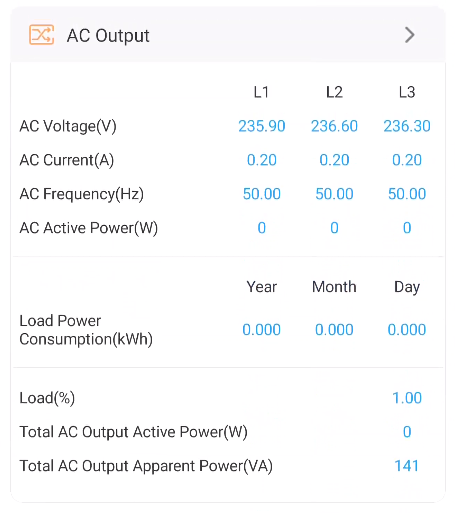
[AC output]
Voltage current, power, load power consumption, etc.
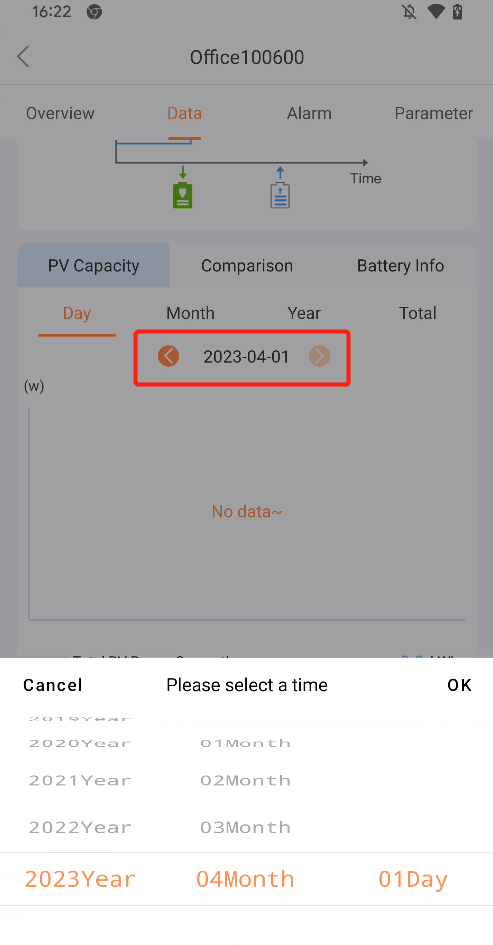
[Date Selection]
Switch the date around and click Open to select the date.

[Pagination]
Switch time left and right, click to select time. The following figure is the total number of pages.
